Exclusive Feature: Professor Ed Altman on Where We Are In The Credit Cycle

Where Are We In The Credit Cycle?
An Average Current Scenaro — But Is It Really Average?
By Edward I. Altman*
There are certain times in our economic and financial environment when it makes sense to assess carefully and dispassionately where we are in the credit cycle and how this cycle relates to the business cycle. Now is one of those times, as the economic uncertainties mount to substantial levels. This note reflects my long history of studying credit cycles going back to the early 1970s. My current assessment is that the Benign credit cycle we have enjoyed since 2010, with the exception of a few months in early 2020, is over. We recently reached an inflection point to an Average credit risk scenario. The later assessment is based on a number of historical indicators over the last 60 years. This conclusion is tempered by the strong likelihood that the U.S. credit picture will continue its heightened risk trend toward a Stressed scenario by year’s end, and if we continue to incur unexpected shock catalysts, similar to the recent Crypto and Silicon Valley Bank and other banking meltdowns, combined with a “hard-landing” economic recession, we could witness another financial-credit crisis, with non-financial corporate risky debt default rates rising to perhaps 10%, or more, over one or two years.
Credit Cycle Indicators
I base my assessment on comparing the current economic and financial environment to five fairly transparent indicators, and their historical annual averages (or current levels), over the last 60+ years, including:
(1) Default Rates, both current and expected, in leveraged finance markets, primarily the High-Yield (HY) Bond and Leveraged Loan markets — 3.3% average per year for HY Bonds.
(2) The current and forecasted level of Recovery Rates when corporate obligations default — 45% of par value.
(3) Required Rates of Return by risky debt investors based on risk premiums compared to yields on “risk-free” US Treasuries — the so-called yield spread — 5.2% average annual.
(4) The High-Yield bond market’s Distress Ratio: The percent of HY bonds yielding at least 10% above the comparable duration Treasury Rate — 8–10% level.
(5) Liquidity in the risky debt market, as measured by the recent amount of risky debt being issued and accepted by the market, including the most risky CCC new issuance — Ample, at least $250 billion annual issuance of HY Bonds and CCC issuance of at least 10–15% of total new HY bond issuance (or comparable percentages of leveraged loan new issuance).
While all of these indicators are fairly transparent and mostly forecastable, the one that is most difficult to measure — and certainly to forecast — is Market Liquidity; perhaps also the most important.
Where Are We Now?
As is now obvious, my primary frame of reference is the U.S. HY Bond market, one that I had the good fortune to study from almost its inception in the late 1970s when this market was nascent and mostly fallen angels, about $10 billion outstanding. At that time, many investment banks and some institutional investors were considering underwriting and investing in this new, non-investment grade capital market that had been essentially closed up to then to corporate issuers as an alternative source of financing. As is now well known, this High-Yield, or “junk bond,” market has grown from those early days to between $1.5–2.0 trillion outstanding today, depending on who is measuring the market’s size, and the loan equivalent, leveraged loans, also about $1.5 trillion outstanding. Finally, the nonbank, or shadow bank, leveraged loan bank market is probably over $1 trillion today in the U.S., and growing all over the world.
Where are we now as of the end of the first Quarter of 2023 and how will 2023 shake out? The last few years’ annual default rates on HY Bonds were 0.5% in 2021, 1.3% in 2022 and Year-To-Date in 2023 (Q1) at about 0.7%. More important, I expect the 2023 annual default rate to climb to 3.5%, about the historical average. This forecast is based on three, equally weighted, factors that we consider, including (1) historical mortality rates (based on a Journal of Finance, 1989 study’s actuarial methodology of bonds issued at various bond rating levels by S&P), (2) the current yield spread required by HY Bond investors, and (3) the current Distress Ratio. The latter two factors are based on market-based regression results of point estimates of investor required yields and distress ratios regressed on subsequent one-year default rates, while the first is based on the mortality statistics of more than 3,500 defaulted issues since 1971.
Analyzed together, our forecast is a 2023 HY Bond Default Rate of just about the historical average of 3.5%. This forecast is actually fairly conservative compared to other forecasters, namely the various rating agencies, e.g. Moody’s is 5.2%, KBRA’s rate is 4.5%, Fitch’s rate is 3.5%, S&P’s current forecast is 4.0%. Fitch and KBRA’s rate is dollar-based, as is our forecast, while Moody’s and S&P are issuer-based.
Recovery Rates
We measure the weighted Average Recovery Rate on Defaulted Bonds (bankruptcy, missed interest payment or principal not cured in grace period, and distressed exchanges) based on the market price of the bonds just atier the default date. The Recovery Rate was 60% in all of 2022, but has fallen to 36% so far (Q1) in 2023 (albeit based on a small sample of defaults). Our forecast is that the Recovery Rate in 2023 will revert to approximately the historical mean (45%) for all of 2023 (based on our Journal of Business, 2005 regression analysis).
Required Yield Spreads
As of Q1-2023, the HY Market’s (ICE Index) YTM spread was 4.83% and the Option Adjusted Yield Spread (OAS) was 4.58%, but still slightly below the historical averages (5.2%). Again, indicating a reversion to the mean trend.
Distress Ratio
As of Q1-2023, the ICE Index HY Distress Ratio was about 8.0%, just slightly below the historic average (9%), but again rising from levels in most of 2022.
Liquidity
As noted earlier, an extremely important, but illusively forecastable, measure is the liquidity of risky debt. Thus far in 2023, about $35 billion of new HY bond issues and a similar relatively small amount of leveraged loans has been issued, with the markets essentially drying up since the Silicon Valley Bank failure on March 10th, with just one CCC issue in Q1, similar to the second half of 2022. New issue volume for all of 2022 was just $ 105 billion, less than half a normal year in the last ten years. So, for the last three quarters, the liquidity of risky debt has been minimal. Very few HY Bond and Leveraged loan issues came due in this period which could have delayed the occurrence of defaults. While the faucet of liquidity could be turned on once again if the markets, stocks and bonds, setle down, we expect the 2023 new issue amounts to fall dramatically below the historic mean. In addition, banks and probably non-bank lenders are fast becoming risk averse, tightening lending standards.
Conclusion Based on the Indicators
Our conclusion is for an “Average” credit cycle year in 2023 as several positives still exist offsetting the well-publicized negatives of inflation, elevated interest rates, and a likely recession. These positives include still robust corporate revenue and cash flow growth, especially amongst firms able to pass along the escalating costs due to inflation to customers, a limited amount of bonds and loans maturing in 2023, and still high but declining inflation and interest rates. The “wild card” is the upcoming interest rate policy of the Federal Reserve in response to these headwinds, but it is looking most likely that we will continue observing relatively small increases of interest rates in the short run and possibly a halt to such increases in later months of the year.
Our final lament is to ask if this is really an average credit cycle for much longer?
The Credit Cycle and the Business Cycle
The Exhibit below clearly shows that the time series relationship between HY Bond Default Rates and economic recessions is potentially important and surprising to many economists. It indicates that annual default rate trends (solid line) have been a leading indicator of recessions (yellow bars) in every instance of the last three/four recessions in the U.S. (1990/91, 2001/02, 2008/09, but understandably less so in 2020, the short lived pandemic recession). In all cases, except 2020, Default Rates increased from a low, benign level from one to three years prior to the onset of the recession, indicating that corporate distress can portent a general economic malaise. The one hiccup in this assertion is the escalating trend in corporate defaults in 2016, caused by the temporary energy crisis and a number of related company large defaults, which was not followed by a general economic downturn.
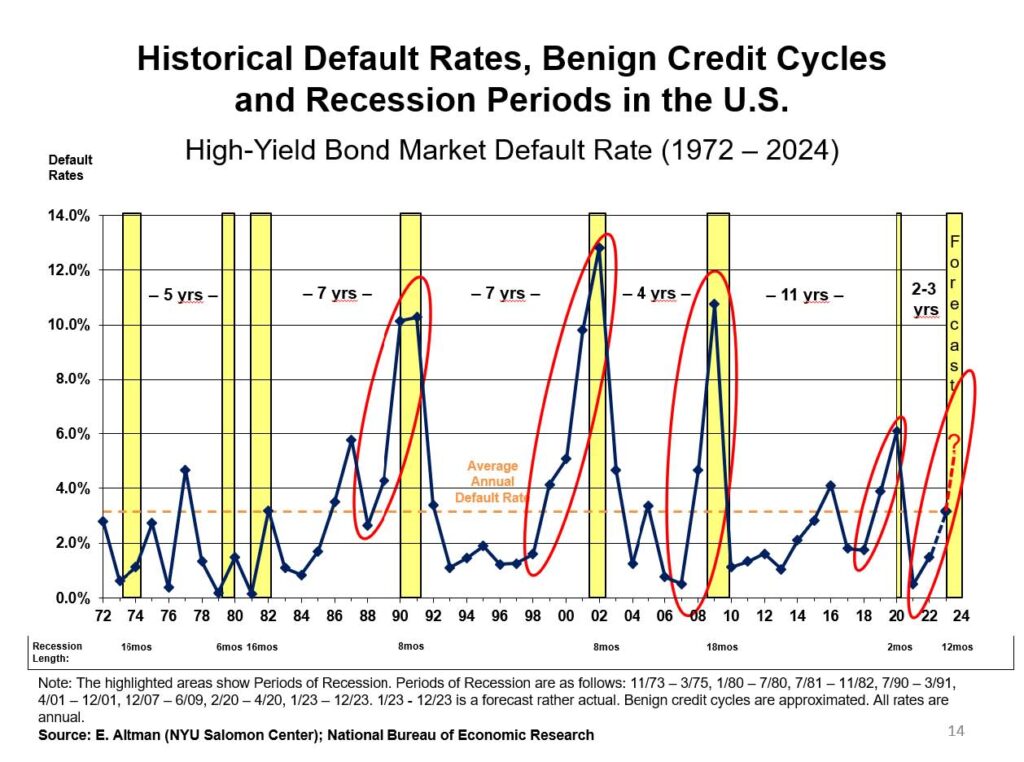
Fast forward to the current situation, note that default rates were at an abnormally low level in 2021 (0.5%) due to government and Federal Reserve support of most enterprises, to 1.3% in 2022, and year-to-date in Q1-2023 at about 0.7%. The later if we take the license to extrapolate for the rest of the year, results in an average default rate of close to 3.0% and close to our forecast. It should be noted again that all four major rating agencies are forecasting an even higher than average HY Bond default Rate in 2023, with the average of the four being 4.3%. If we do have a recession in late 2023 into 2024, and that recession resembles a ‘hard landing’, as some economists are now forecasting atier the recent banking crisis, the Default Rate and all of our other indicators could deteriorate to a “stressed” or even “crisis” level of double digit default rates and extreme illiquidity conditions. So, will 2023 really be “average” when all is said and done? I have my doubts!
*Dr. Altman is the Max L. Heine, Emeritus Professor of Finance at the NYU Stern School of Business and Director of the Salomon Center’s Credit and Debt Market Research Program.
Copyright April 12, 2023 Creditor Rights Coalition
Please contact info@creditorcoalition.org for reprint permission.