Special Feature: Professor Ed Altman on Where We Are In The Credit Cycle and Outlook for 2024

Where Are We In The Credit Cycle and Outlook for 2024
An Average Current Scenario in 2023 — But Was It Really Average?
By Edward I. Altman*
There are certain times in our economic and financial environment when it makes sense to assess carefully and dispassionately where we are in the credit cycle and how this cycle relates to the business cycle. Now, in early 2024, is one of those times, as the economic uncertainties are at substantial levels. This note reflects my long history of studying credit cycles going back to the early 1970s. My current assessment is that the Benign Credit Cycle we have enjoyed since 2010, with the exception of a few months in early 2020, ended in 2023. We recently reached an inflection point to an Average credit risk scenario. This assessment is based on analysis of a number of historical indicators over the last 50 years. This conclusion is tempered by the possibility that the U.S. credit picture will continue its heightened risk trend toward a Stressed Scenario by the end of 2024, and if we continue to incur unexpected shock catalysts, similar to the recent Crypto and Silicon Valley Bank crises, other banking meltdowns, or geopolitical crises, combined with a “hard-landing” economic recession, we could witness another financial-credit crisis, with non-financial corporate risky debt default rates rising to perhaps 8-10%, or more, over one or two years. While this scenario is unlikely as GDP in the U.S. has been unexpectedly resilient, especially in the second half of 2023, we should continue to be vigilant as to corporate distress. Indeed, in Q1 of 2024, corporate Chapter 11 bankruptcy filings have spiked significantly compared to the comparable 2023 period, with increases of 46% compared to the similar quarter of 2023 and 36% more than the average number of filings for the period of 2018-2024. Indeed, even higher than during the comparable GFC periods.
Credit Cycle Indicators
I base my assessment of the current credit cycle on comparing the current economic and financial environment to five fairly transparent indicators, and their historical annual averages (or current levels), over the last 50+ years, including:
(1) Default Rates, both current and expected, in leveraged finance markets, primarily the High-Yield (HY) Bond and Leveraged Loan (LL) markets —– 3.3% average per year (1986 – 2023) for HY Bonds and 3.0% for leveraged loans (2007 – 2023), measured in dollars.
(2) The current and forecasted level of Recovery Rates when corporate obligations default —-45% of par value historically for fixed rate high-yield bonds and 60-65% for floating rate loans.
(3) Required Rates of Return by risky debt investors: based on risk premiums compared to yields on “risk-free” US Treasuries – the so-called OAS yield spread —– 5.4% average annual.
(4) The High-Yield Bond Market’s Distress Ratio: The percent of HY bonds yielding at least 10% above the comparable duration Treasury Rate —– 8- 10% level, historically.
(5) Market Liquidity in the risky debt market, as measured by the recent amount of risky debt being issued and accepted by the market, including the most risky CCC new issuance —— at least $250 billion annual issuance of HY Bonds and CCC issuance of at least 10-15% of total new HY bond issuance. Comparable issuance in the leveraged loan market.
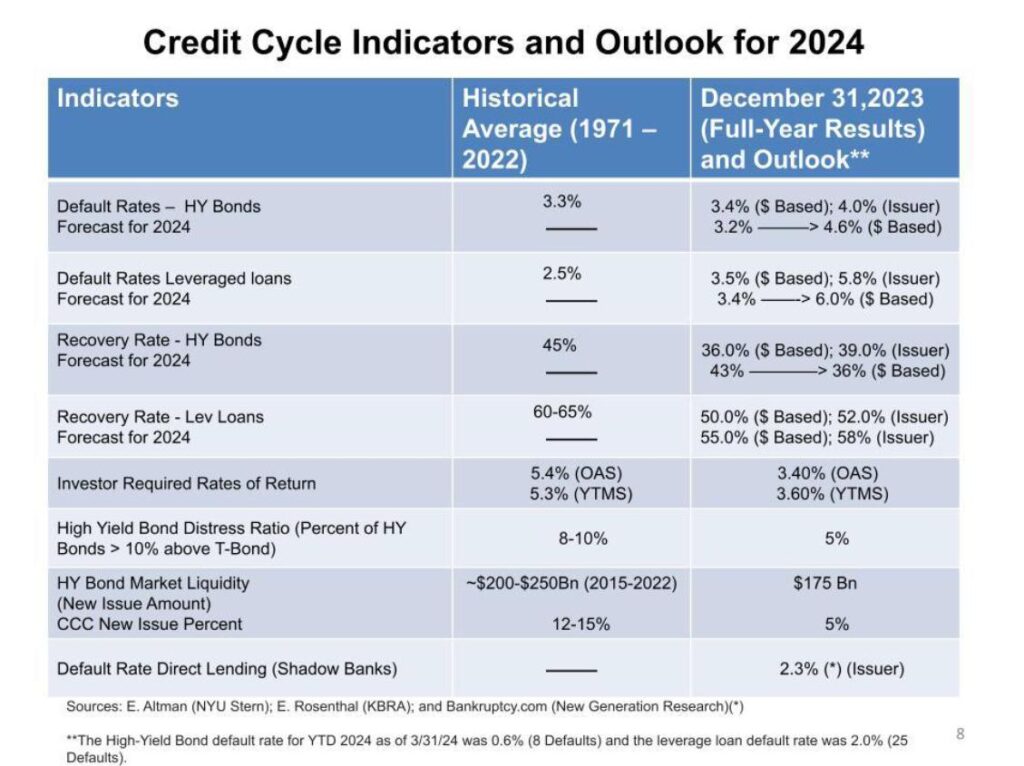
While all of these indicators are fairly transparent and mostly forecastable, the one that is most difficult to measure, and certainly to forecast, is Market Liquidity; perhaps also the most important. The summary stats for 2023 for all five indicators, and a few others, can be found in Figure 1.
Figure 1
Where Are We Now?
My primary frame of reference is the U.S. HY Bond Market, one that I had the good fortune to study from almost its inception in the late 1970s when this market was nascent and mostly fallen angels, about $10 billion outstanding. At that time, some investment banks and institutional investors were considering underwriting and investing in this new, non-investment grade capital market that had been essentially closed up to then to corporate issuers as an alternative source of financing. As is now well known, this High-Yield, or “junk bond”, market has grown from those early days to about $1.5 trillion outstanding today in the U.S. and about €600 billion in Europe, depending on who is measuring the market’s size, and the loan equivalent, leveraged loans, also about $1.5 trillion outstanding in the U.S. Finally, the nonbank, or shadow bank loan market, is probably over $1.5 trillion today in the U.S., and growing in most countries. The Chinese non-bank loan market (mainly Trusts) is the largest in the world, estimated at $3 trillion, but not growing currently as the real estate market for new financing is dormant.
One new indicator of corporate credit risk is the default rate compilation of the non-bank loan market as created and maintained by KBRA’s “Direct Lending Debt (DLD)” group. The percentage of defaults (based on number of defaults, not dollars) of about 2,400 direct loans made by non-banks to primarily highly leveraged private-equity owned companies, provides the most comprehensive measure of this somewhat opaque market. In 2023, the estimated default rate was 2.3% (see bottom of Figure 1), less than one half of the issuer based 2023 default rates on LL reported by several of the rating agencies. At this time, there are no direct lending market default rates for years prior to 2023, at least that I am aware of.
Where are we now early in 2024 and how will the rest of the year shake out? The last few years’ annual default rates on HY Bonds were 0.5% in 2021, 1.3% in 2022 and 3.4% in 2023. More importantly, I expect the 2024 annual default rate to climb to between 3.2% to 4.0% in 2024, depending upon if the U.S. and European economies incur a “soft” or “hard” landing, or no recession. My forecast is based on three, equally weighted, factors that we consider, including (1) historical mortality rates (based on a Journal of Finance, 1989 study’s actuarial methodology of bonds issued at various bond rating levels by S&P)1, (2) the current yield spread required by HY Bond investors, and (3) the current Distress Ratio. The latter two factors are based on market based regression results of point estimates of investor required yields and distress ratios regressed on subsequent one year default rates, while the first is based on the mortality statistics of more than 3,500 defaulted issues since 1971.2
Analyzed together, our forecast is a 2024 HY Bond Default Rate ($ based) of at just below or just above the historical average. This forecast is actually fairly conservative compared to that of most other forecasters, namely the various rating agencies, except for KBRA, and some investment banks.
The expected default rate for more interest-sensitive leveraged loans is higher than for high-yield bonds and, as such, has a lower correlation to the historical experience since 2005 (0.92 correlation). For 2024, the leveraged loan default rate could hit as high as 6.0%!
Recovery Rates
We measure the weighted average Recovery Rate on Defaulted HY Bonds (bankruptcy, missed interest rate or maturity payments, or Distressed Exchanges) based on the market price just after or 30-days after the default date. This recovery rate was an above average 60% in 2022 when the default rate was a below average of 1.3%, but fell to 36% in 2023, indicating increased risk in 2023 and likely beyond. My forecast for 2024, if default rates remain about average, is an increase to close to the historical level of 45% for bonds and 60-65% for loans. This is based on regression results from our Journal of Business article, Altman et al (2005).3
Required Yield Spreads
As of the end of Q1 2024, the HY Bond Market’s (ICE Index) Option-Adjusted Yield Spread (OAS) was about 3.5%, far below the historical average level (5.4%), indicating the market’s expectation of below-average credit risk. This spread is even lower as of early May 2024. This unusually low measure was surprising to me, given several high-risk factors, including historically high corporate leverage levels, especially amongst highly leveraged companies, and an increasingly high level of maturities in 2024, and especially in 2025 in most industrial sectors (“Waterfall analysis”) and an uncertain level of GDP, inflation, and corporate profit outlook. No doubt, this very low risk premium level is primarily driven by the outstandingly positive stock market performance of late, since HY Bonds and LL correlate very highly with prices of common stocks, perhaps close to 80% correlation. In addition, there are several other reasons for the unusually low HY bond spread, including (1) competitive candidates for the growing size of the non-bank, private credit market, (2) high absolute yields available due to high relative interest rates and (3) ample funds for investment by HY and LL mutual funds and other leveraged finance investors.
Distress Ratio
The same factors that have determined the yield-spread statistics at the end of 2023 and into 2024 are driving the HY Distress Ratio percentage of about 5% at the start of 2024. Recall that the historic average is almost double this percentage. Hence, another indicator of below average credit risk perception.
Liquidity
As noted earlier, an extremely important, but illusively forecastable, measure is the liquidity of the risky debt market. In 2023, $175 billion of new HY Bonds were issued (B of A estimate), which while about $75 billion below recent average year levels, did show a measurably high increase in the last quarter of 2023, and a continued robust level in early 2024 (already almost $90 billion in Q1). This market is, however, extremely volatile, subject to dramatic shifts as conditions change, and especially when unexpected catalysts manifest, e.g. crypto crises or bank failures, like Silicon Valley Bank, et. cetera. This is especially true of the most risky CCC-rated market. The latter’s new issuance is a market I closely watch! Again, the stock market’s high-correlation association is critical. In addition, banks and probably non-bank lenders became more risk-averse in 2023, with more tightened lending standards, mainly due to exceptionally high leveraged ratios of non-financial corporates and continued high interest rates.
Conclusion Based on the Indicators
My conclusion is that the US leveraged finance market, and probably the European market, incurred an “Average” credit cycle performance in 2023, as several positives continued to manifest, offsetting the well published negatives of high inflation, elevated interest rates and a possible recession. These positives include still robust corporate revenue and cash flow growth, especially amongst firms able to pass along the escalating costs due to inflation to customers, a limited amount of bonds and loans that matured in 2023, and still high but declining inflation.
One positive indicator of corporate robust revenue and cash flow performance that is not as well known, but we find increasingly important as a forecast of larger non-financial companies and GDP performance, is the so-called U.S. Middle-Market firm trend. For this, I rely upon the Golub Capital Altman Index of year-over-year performance of a select number of analyzed mid-market firms.4 This index showed record positive year-over-year growth of sales and profits in Q3, and especially Q4, of 2023.
The ‘wild-card’ is the upcoming interest rate policy of the Federal Reserve, but it is looking most likely that we will observe a relatively small decrease of interest rates in the short run in 2024. The likely reduction of interest rates by central banks in 2024 will be mitigated, I believe, by the enormous amount of new debt financing by governments as they try to finance their deficits and persistent inflation.
Our final lament is to ask if this is really an average credit cycle for much longer?
The Credit Cycle and the Business Cycle
Figure 2 below clearly indicates, to me anyway, that the time series relationship between HY Bond Default Rates and economic recessions is potentially important and surprising to many economists. It indicates that annual default rate trends (solid line) have been a leading indicator of recessions (yellow bars) in every instance of the last three/four recessions in the U.S. (1990/91, 2001/02, 2008/09, but understandably less so in 2020, the short lived pandemic recession). In all cases, except 2020, Default Rates increased from a low, benign level from one to three years prior to the onset of the recession, indicating that corporate distress can portent a general economic malaise. The one hiccup in this association is the escalating trend in the U.S. in corporate defaults in 2016, caused by the temporary energy crisis and a number of related large company defaults, which was not followed by a general economic downturn.
Figure 2
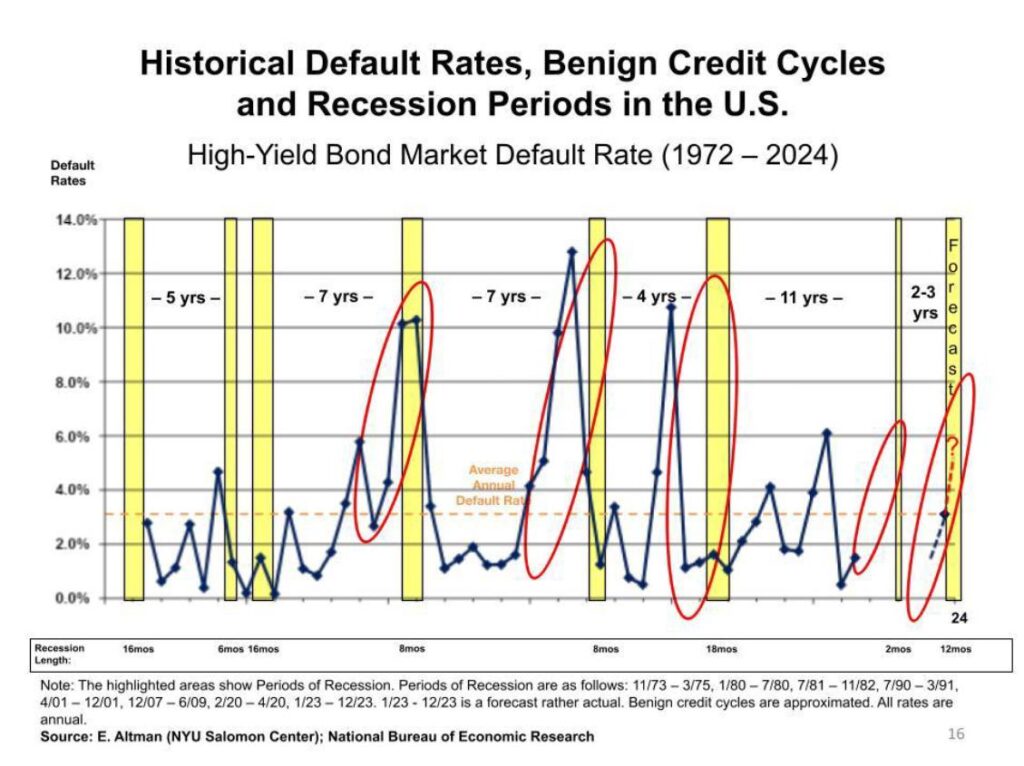
Fast forward to the current situation, note that default rates were at an abnormally low level in 2021 (0.5%) due to the U.S. Government and Federal Reserve support of most enterprises, to 1.3% in 2022, and 3.4% in 2023. It should be noted again that most of the major rating agencies are forecasting an even higher than average HY Bond default Rate in 2024. If we do have a recession in 2024, and that recession resembles a “hard landing”, as some economists are still forecasting after the recent banking crisis and high inflation rates, the Default Rate and all of our other indicators could deteriorate to a “stressed” level of double digit default rates and extreme illiquidity conditions. So, was 2023 really “average” when all is said and done? I have my doubts! As for 2024, my forecast of the credit cycle is likely not to be for an above average risk level as several indicators, e.g. default rates, required returns, distress ratios, and possibly liquidity, are at average or below average risk levels. Recovery rates are the only indicator at above average risk and the big unknown is liquidity, especially later in 2024.
2024 – Q1 – Year To Date
In 2024, according to Bankruptcy.com, the trend of a growing number of corporate bankruptcies continued with 1,866 Chapter 11 filings. This is a 47% increase over the comparable Q1 in 2023 and a 36% increase over the number of Q1 filings in the 7-year period 2018-2024. The current year’s Q1 volume of filings actually was greater than the number in 2020, the first and most dramatic year of the pandemic.
The latest corporate bankruptcy Chapter 11 filings increase mirrored the huge increase in leveraged loan defaults in Q1-2024, which were 25, with a volume of $30 billion and a 2.0% default rate in Q1 (YTD)! If this trend of interest rate-sensitive company defaults continues for the rest of 2024, the annual default rate could rise to almost a crisis level 8.0%! Projections of highly risky leveraged loans indicate a somewhat lower 2024 annual default rate.
The dramatic increase in Chapter 11 filings in Q1 2024 was amplified by a substantial rise in SubChapter V filings which are available to smaller companies with liabilities equal to or less than $7.5 million. This version of Chapter 11 usually results in faster and less expensive reorganizations.
Interestingly, the corporate High-Yield bond defaults in Q1 2024 (YTD) was only $9 billion on just 8 defaults, for a 0.6% YTD default rate. The difference between the huge leveraged loan default count and dollar volume default rate and that of High-Yield bonds is due to the fact that leveraged loans are mostly floating rate obligations, while HY bonds are mostly fixed rate and most of those debts were issued at much lower interest rates than is currently the case for leveraged, non-investment grade debt. The latest data on direct lending, non-bank debt is not yet available for Q1-2024. So, the current YTD default scenario is sending a mixed message. Still, the near term record of bankruptcy organization filings and leveraged loan defaults is perhaps surprisingly high given the seemingly robust macro-economic environment.
Copyright 2024 Creditor Rights Coalition
*Dr. Altman is the Max L. Heine, Emeritus Professor of Finance at the NYU Stern School of Business and Director of the Salomon Center’s Credit and Debt Market Research Program. He is also a Senior Advisor and co-founder of Wiserfunding, Ltd (London & Mumbai) and Classis Capital, SCF S.p.A. (Milan). This article is an expanded and updated report on an earlier release from the Creditor Rights Coalition, April 2023.
References
1. E. Altman (1989), “Measuring Corporate Bond Mortality and Performance,” Journal of Finance, 23(4), 589-609.
2. E. Altman (2018), “A Fifty-Year Retrospective on Credit Risk Models, the Altman Z -Score Family of Models and their Applications to Financial Markets and Managerial Strategies,” Journal of Credit Risk, 14(4), 1-35.
3. E. Altman, B. Brady, A. Resti, and A. Sironi (2005), “The Link Between Default and Recovery Rates: Theory, Empirical Evidence, and Implications,” Journal of Business, 78(6), 2203-2228.
4. The Golub Capital Altman Index can be found on Golub Capital’s website and its “Middle Market Reports.” The latest report was on April 9, 2024.